Summary
A project on creating omnichannel dashboards for clients, then ultimately abandoning them bc clients didn’t like them.
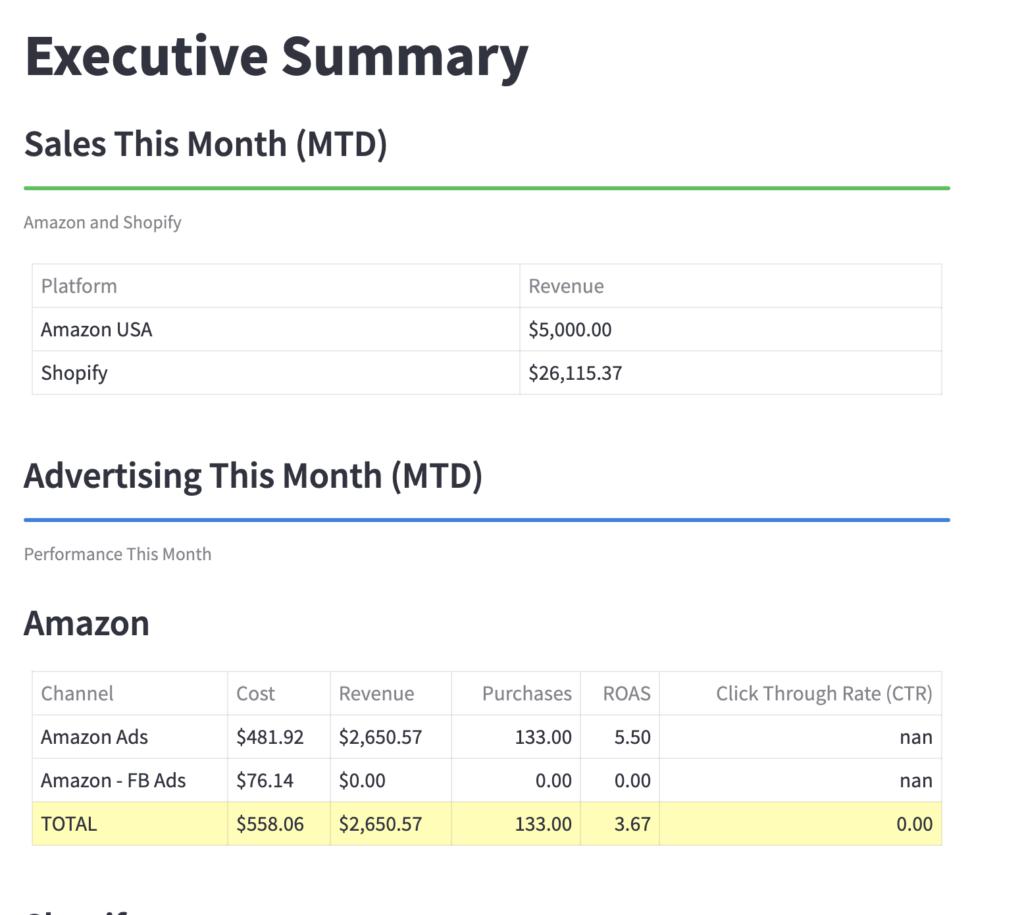
This is an interactive streamlit dashboard using data hosted on Amazon S3 buckets. Available at marketing.streamlit.app.
The code for the dashboard is available for free at Github, but I should warn you it’s a little messy. It was my first python project to be honest…
Setup & Github
Here is the setup I used to make it happen:
- Wrote python script to generate reports (not included in github)
- Requests, Google Ads API, SP-API, and amazon ads api library to get data
- Pandas for organizing data & formatting
- Amazon S3 for hosting each report
- Amazon Cloudfront for encrypting the bucket & invalidating cache when the report was updated
- Wrote streamlit dashboard script (included in github)
- Uses pandas, plotly, datetime, and streamlit libraries
- Deployed to streamlit cloud (free)
On Streamlit Cloud & Deployment
I deployed with Streamlit Cloud because it’s free. To be honest, it’s a bit problematic (at the time of writing,) as Streamlit seems to be updating its code which is causing my app to break.
Note: maybe this is my fault—like maybe the requirements.txt file is not set up correctly, but I still feel like it shouldn’t be so hard to keep the same library versions.
To avoid this, you can deploy the streamlit apps on Heroku or AWS. That will easily prevent library versions from being updated. It will also prevent your app from needing to be ‘woken up’, which proved disastrous for engagement.
App Wake up
While free, Streamlit cloud ‘puts apps to sleep’ when they are not used for a certain period of time. As a result, when busy executives received my links to their data dashboard, they’d have to load streamlit, click ‘wake up’ the app, then wait a couple of minutes for it to relaunch. Not good.
Thoughts
Clients
Long story short, I realized no one was using these dashboards. While this was frustrating, moving to pdf reports ended up being more effective & actually easier to use.
The dashboards could be great for presenting during a meeting or conference, but for reporting, it’s just not intuitive enough.
UX
It wasn’t as user-friendly as I expected. To me, it was obvious, but clients, not so much. And that’s what mattered! 😅😭
On top of waiting minutes for the app to load, clients also had to learn how to use the dashboard. And for some reason, they just didn’t want to learn it. I even included a how-to page to explain how to use it, but they just weren’t having it!
One client told me ‘it looks great, but it’s all German to me.’ As a marketing pro, the info is great. However, they just weren’t sure how to interpret it or what story it told.
So, of course that meant less engagement. Which meant less questions, more confusion, and less understanding of what I actually did. Turns out this was even less effective than just sharing excel files. Kinda sucks!
Use & Self-Criticism
It’s still useful tech! I don’t not recommend it for individuals, for presenting, and tech-centered teams.
It’s a great highly-customizable alternative to a Google Data Studio or paid reporting app. I also think it looks pretty. But maybe that’s just because I made it. Like an ugly baby...😪
Remember that streamlit has capabilities which extend far beyond displaying marketing data. No offense to myself, but there are way more interesting projects than can be created with Streamlit, so check it out! Could be useful in your tech career…am i self-deprecating or being objective…I don’t know.
What I learned
I learned that client engagement matters more than the time spent on creating a project.
I also learned that pdf reports are better than data dashboards for marketing client service reporting—at least at time of this writing.
Lastly, I learned skills that were extremely transferrable to building AI-integrated reports which have been well-received by clients & which look much better. Will be sharing this project soon!
THe end

Click to read the welcome letter!
Hello!
I’m Michael, a Manhattan-based marketer from Texas.
I work with businesses to improve their revenue & ROI/ROAS online.
My experience includes ~3 years at agencies as an SEO / Ad manager, launching my own successful products online (100+ 5-star reviews on Amazon & #1 rankings on Google & Amazon in under a year!) and entry-level/intern work at production studios, a radio station, and a movie-marketing company.
* I’ve been freelancing full-time since January 2023.
I am strictly compliant with platform policies, stay up-to-date with industry changes, and am familiar with dozens of tools to improve & simplify marketing operations. Additionally, I use automation and AI in-house to analyze data and improve performance.
If you’re interested in talking, feel free to reach out! You can use the buttons below to contact.
Thanks for taking the time to read! I appreciate it.
Michael
Leave a Reply